Data: How many people are shot dead or otherwise killed in OECD countries?

As a follow-up to my recent post on the relationship between gun ownership and gun homicide in OECD countries, I have rolled my dataset (compiled from information published by gunpolicy.org) and my analysis script into a neat Stata package. If you want to recreate the tables and graphs, or otherwise want to play with the…
Creating Matrix-Like Plots in Stata

Matrix Graph in Stata

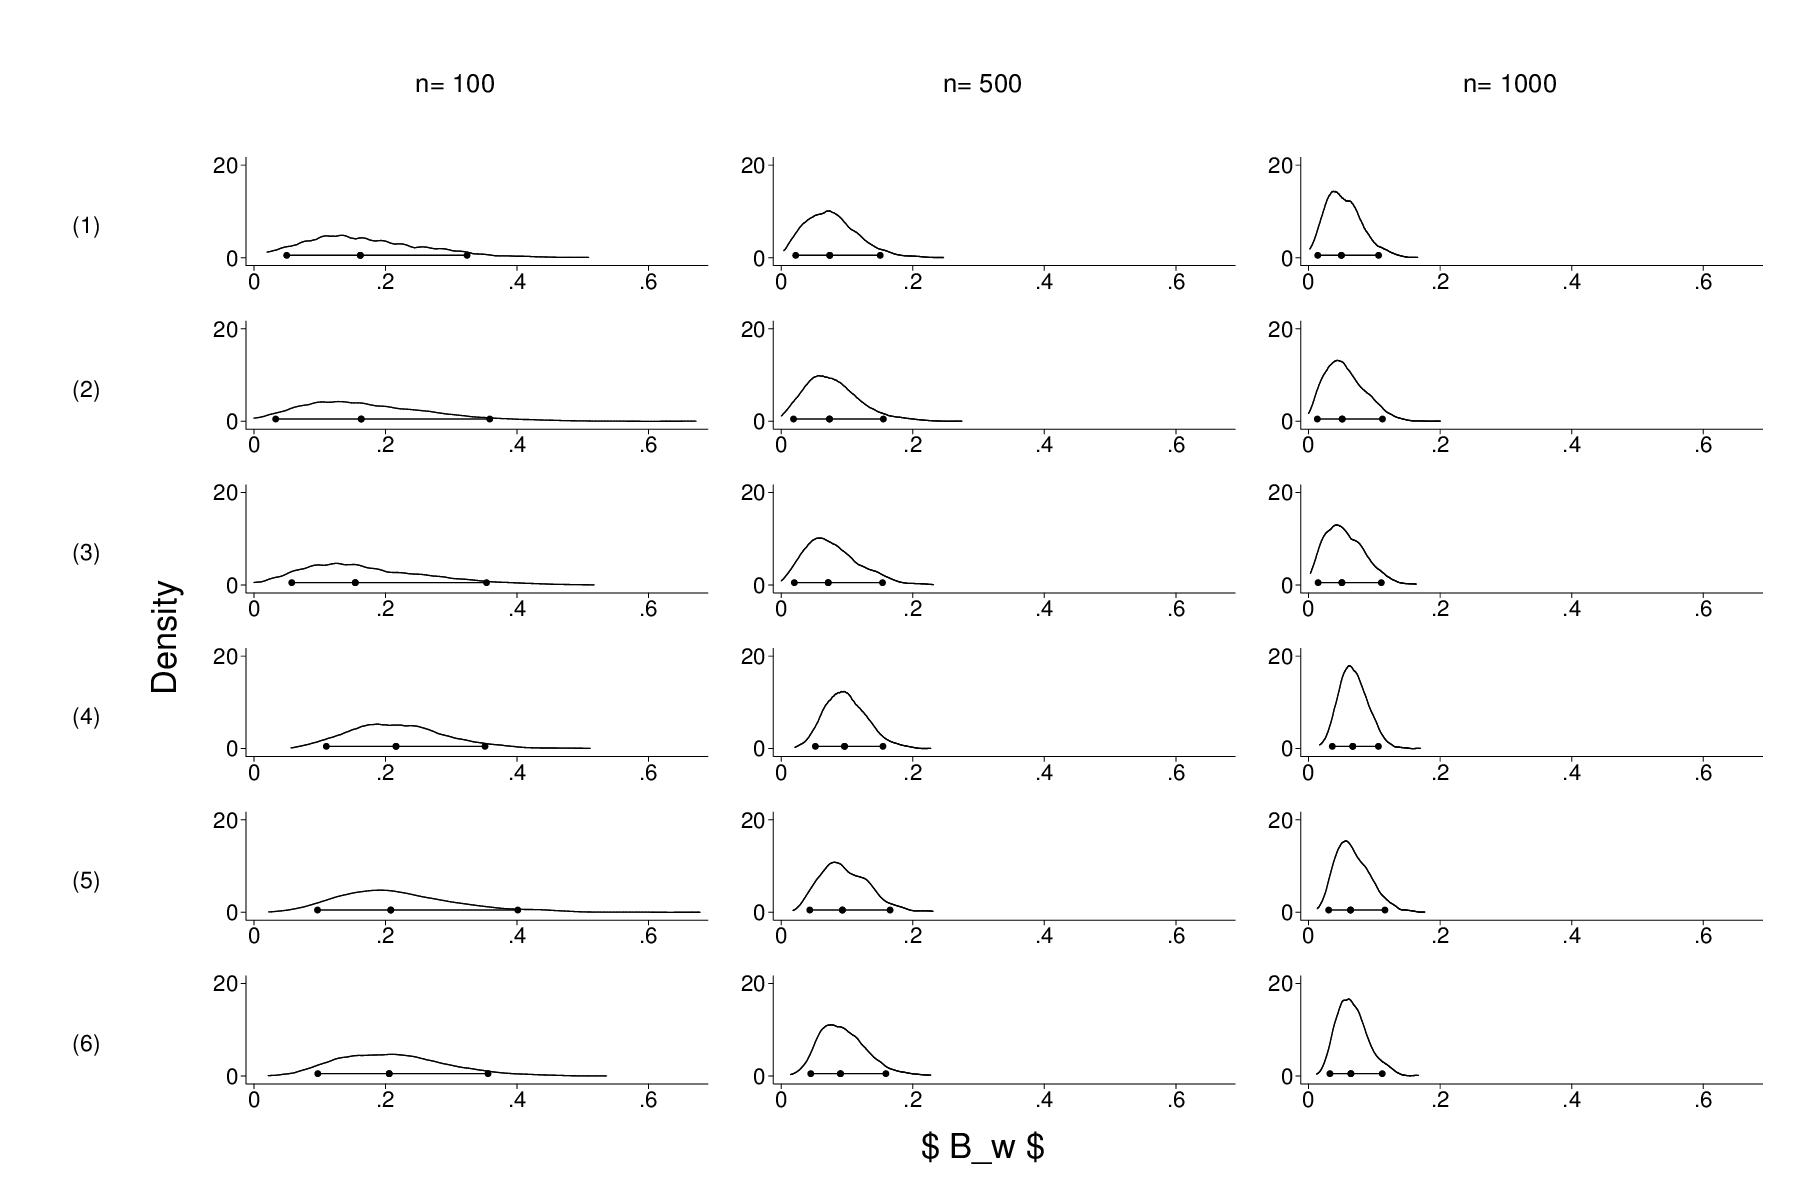
I could find no canned command that produces what I wanted: a table-like arrangement, with labels for the columns (i.e. sample sizes) and rows (experimental conditions). What I could do was set up / label a variable with 18 categories (one for each data set) and use the ,by() option to create a trellis plot. But that would waste a lot of ink/space by replicating redundant information. At the end of the day, I created a nine graphs that were completely empty save for the text that I wanted as row/column labels, which I then combined into two separate figures, that were then combined (using a distorted aspect ratio) with my 18 separate plots. That boils down to a lot of dumb code.

Easy Google geocoding in Stata

For the un-initiated: Geocoding is the fine art of converting addresses into geographical coordinates (longitude and latitude). Thanks to Google and some other providers like OpenStreeMap, this is now a relatively painless process. But when one needs more than a few addresses geocoded, one does not rely on pointing-and-clicking. One needs an API, i.e. a software library that makes the service accessible through R, Python or some other programming language.
geocode is a user-written Stata command that gives access to Googles API from within Stata. It takes a variable containing address strings and returns two new variables containing the latitude/longitude information

Robust Regression of Aggregate Data in Stata

I’m currently working on an analysis of the latest state election in Rhineland-Palatinate using aggregate data alone, i.e. electoral returns and structural information, which is available at the level of the state’s roughly 2300 municipalities. The state’s Green party (historically very weak) has roughly tripled their share of the vote since the last election in…

Are Germans More Afraid of Neo-Nazis Than of Islamists?

Who is afraid of whom? The liberal German weekly Zeit has commissioned a YouGov poll which demonstrates that Germans are more afraid of right-wing terrorists than of Islamist terrorists. The question read “What is, in your opinion, the biggest terrorist threat in Germany?” On offer were right-wingers (41 per cent), Islamists (36.6 per cent), left-wingers…

Sampling from a Multinomial Distribution in Stata

Sometimes, a man’s gotta do what a man’s gotta do. Which, in my case, might be a little simulation of a random process involving an unordered categorical variable. In R, sampling from a multinomial distribution is trivial. rmultinom(1,1000,c(.1,.7,.2,.1)) gives me a vector of random numbers from a multinomial distribution with outcomes 1, 2, 3, and…

Which of my students are most likely to gang up against me?

I’m teaching a lecture course on Political Sociology at the moment, and because everyone is so excited about social capital and social network analysis these days, I decided to run a little online experiment with and on my students. The audience is large (at the beginning of this term, about 220 students had registered for…

How to get from Stata to Pajek

I’m teaching an introductory SNA class this year. Following a time-honoured tradition, I conducted a small network survey at the beginning of the class using Limesurvey. Getting the data from Limesurvey to Stata via CSV was easy enough. Here is the data set. But how does one get the data from Stata to Pajek for…

Software for Social Network Analysis: Pajek and Friends

After trying a lot of other programs, we have chosen Pajek for doing the analyses and producing those intriguing graphs of cliques and inner circles in Political Science. Pajek is free for non-commercial use and runs on Windows or (via wine) Linux. It is very fast, can (unlike many other programs) easily handle very large networks, produces decent graphs and does many standard analyses.