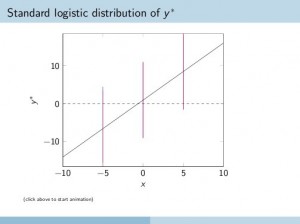
I use emacs/for all my textprocessing needs, and for the last four or five years, I have created all my slides with Till Tantaus excellent “beamer” class. At the moment, I’m teaching a 2nd year stats course (imagine doing this with PowerPoint – the horror! the horror!), so I sometimes use graphs from the assigned text like this one from Long&Freese that illustrates the latent variable/threshold interpretation of the binary logit model. The message should be fairly clear:
depends on
andfollows a standard logistic distribution around its conditional mean.

But the fact that the bell-curve lies flat in the plane confused my students no end. So I wasted half a day on creating a nice 3d-plot for them. After trying several options, I settled on pgfplots.sty, which builds on tikz/pgf, the comprehensive, portable graphics package designed by Tantau (here’s a gallery with most amazing examples of what you can do with this little gem). Plotting data and functions with pgfplots in 2d or 3d is a snap, so that was not too hard. Eventually.
Finally, in a desperate attempt to drive the message home, I enlisted the help of animate.sty, yet another amazing package that creates a javascript-based inline animation from my source (requires Acrobat reader). So the bell-curves pop out of the plane, in slow motion. Did it help the students to see the light? I have no idea. Here is the source.

Discover more from kai arzheimer
Subscribe to get the latest posts sent to your email.


Thanks for that Alexander. I tweaked an existing example to my needs, but your solution is obviously much more concise!
I had a look into the source file animation.tex.
The part that creates the animation frames using the parameterized macro doit can be significantly simplified by replacing the whiledo loop with the multiframe command. Note that the parameter names xb and xc had to be prefixed with `r’ to declare them as `real’ numbers (See the doc animate.pdf for details.).
 begin{animateinline}{9}
 multiframe{15}{rxb=90+-5,rxc=0+5.5}{%
 doit{rxc}{rxb}%
 }
 end{animateinline}
Great work!
Still singing and dancing 😉